



Maximum Drawdown Explained in Simple Terms
Here's how you can use the maximum drawdown to better assess your risk of loss
Maximum drawdown (MDD) is a metric used to assess a portfolio’s risk. Individual investors should monitor their portfolios regularly to limit losses, and MDD is one of the most useful measures for doing so. It shows how badly a portfolio would have fared in the worst case in the past.
This guide answers the key questions about maximum drawdown and explains how individual investors can use it to gauge portfolio risk.
The essentials in brief: Everything You Need to Know About Maximum Drawdown
Risk metric: Maximum drawdown measures the largest peak-to-trough loss a portfolio has suffered.
Investment strategy: The metric helps you measure and assess portfolio risk, and decide whether your portfolio needs adjusting.
Investment horizon: Maximum drawdown varies with the time period you choose, so longer time frames give a more reliable picture.
Buy signal: If a maximum drawdown has just been reached, the market may be oversold and a recovery may be near.

Find and compare thousands of ETFs. Use powerful filters, detailed analytics, and independent data to discover the right ETF for your portfolio.
Definition: What is the maximum drawdown?
Maximum drawdown is an important indicator of a portfolio’s risk, used to assess both performance and risk management. Maximum drawdown represents the largest loss a portfolio has suffered from its peak to its trough. It is calculated as a percentage of the peak and shows how much money an investor could have lost in the worst case. Maximum drawdown is a one-sided risk measure because it captures only downward movements, so it starts at zero and can only be negative.
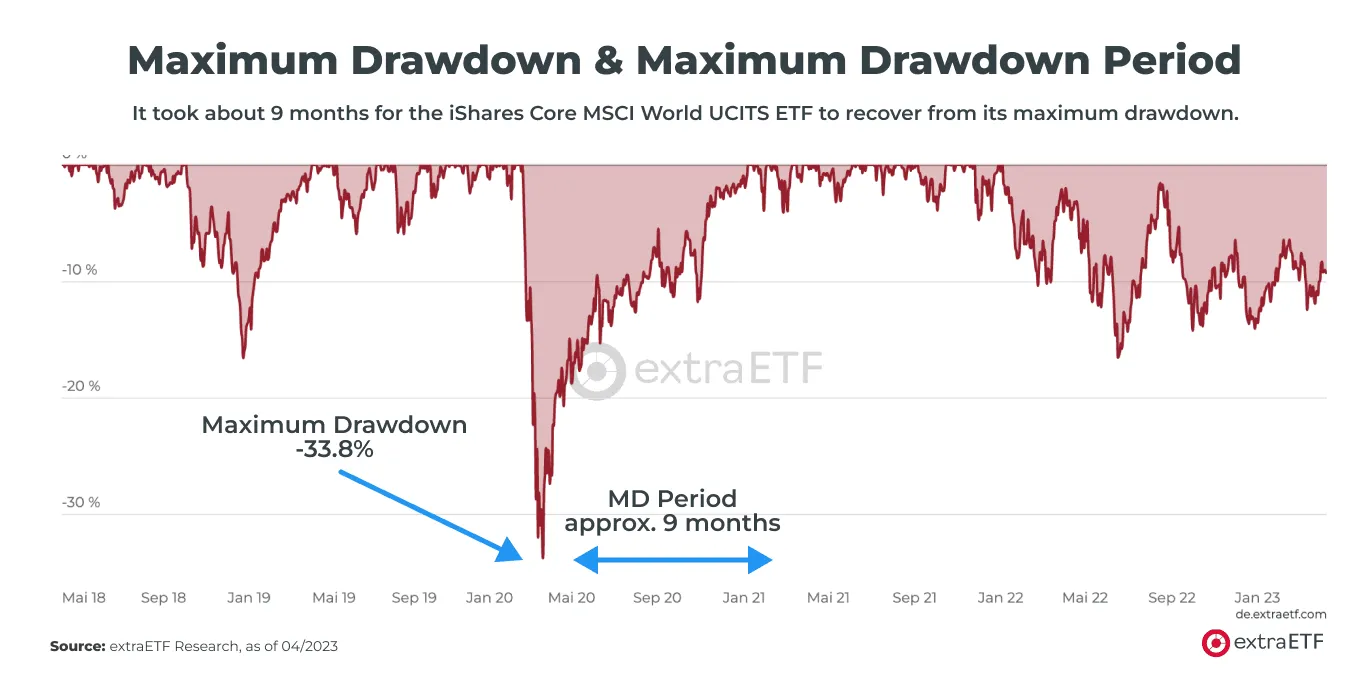
A low maximum drawdown generally points to lower volatility and lower risk, while a high one usually signals higher risk. The maximum drawdown period is the time between the maximum drawdown and the point at which the portfolio regains its previous peak.
Join the extraETF community
Explore the world of ETFs and make informed investment decisions.
- Find ETFs that match your criteria with our ETF Search.
- Compare costs, performance, and risk side by side.
- Save your favourites to a watchlist and receive price alerts.
- Explore detailed ETF profiles with key metrics and holdings.
Why is maximum drawdown important for investors?
Maximum drawdown matters to investors for several reasons: it helps them measure and assess portfolio risk, and it can prompt changes to their risk management strategy.
- Risk assessment: Maximum drawdown indicates how much money could be lost in a sudden market crash. A higher maximum drawdown indicates higher risk.
- Portfolio performance: Maximum drawdown is often used as a gauge of a portfolio’s performance. A low maximum drawdown suggests the portfolio is more stable and has generally delivered better results.
- Risk management: A higher maximum drawdown may suggest the portfolio is too risky and needs reviewing to reduce risk.
- Diversification: Maximum drawdown can inform diversification decisions. Spreading investments across different asset classes and strategies reduces the risk of large losses.
Formula: How is the maximum drawdown calculated?
Maximum drawdown is calculated as a percentage and refers to the largest loss a portfolio has incurred between its highest and lowest values. You therefore need two values to calculate it: the portfolio’s highest value and the lowest value it has reached.
Maximum drawdown is calculated using the following formula:
Maximum Drawdown = (Lowest Value / Highest Value - 1) * 100
Example: If a portfolio’s highest value is £10,000 and its lowest value is £8,000, the maximum drawdown is -20%. The calculation is: (8,000 / 10,000 - 1) * 100 = -20%.
The result is expressed as a percentage. Alternatively, the maximum drawdown can be stated as an absolute value. Bear in mind that maximum drawdown is a backward-looking indicator that reflects a portfolio’s past performance.
What is the maximum drawdown of the MSCI World Index?
The maximum drawdown of the MSCI World Index depends on the time period for which it is calculated. For the period from 2010 to the end of 2022, the maximum drawdown of the iShares MSCI World UCITS ETF was approximately 34%. This means that the ETF lost about one-third of its peak value during this period. However, the maximum drawdown of the ETF will differ over other time periods.
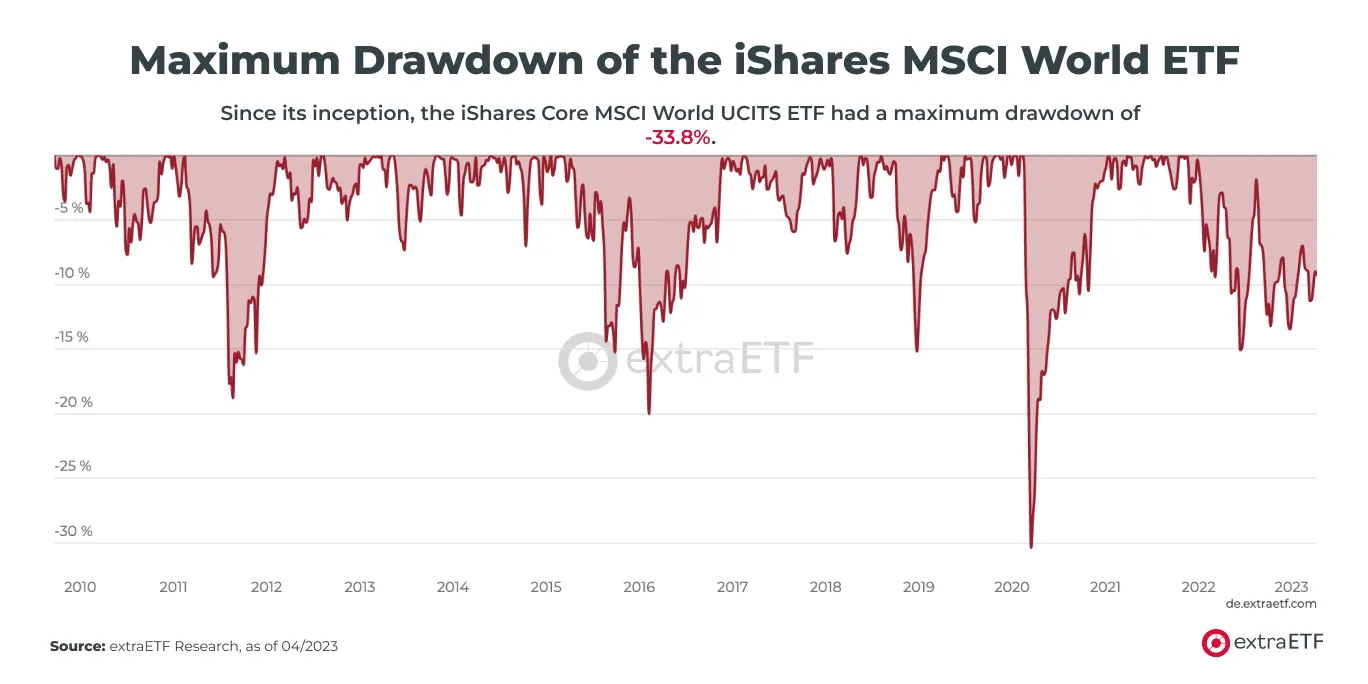
To show how much maximum drawdown depends on the period reviewed, we now look at different market phases.
Maximum Drawdowns Compared Across Different Assets
The table shows that stock indices in particular have suffered significant maximum drawdowns in the past. By comparison, the maximum drawdowns for gold, commodities and bonds were lower. This underlines the importance of diversification across different asset classes.
| Index / Asset Class | Maximum Drawdown (%) | Time Period |
|---|---|---|
| S&P 500 Index | - 56.4% | Sept. 2007 – March 2009 |
| Nasdaq Index | - 78.4% | March 2000 – Oct. 2002 |
| Nikkei 225 Index | - 80.2% | Dec. 1989 – Oct. 1998 |
| FTSE 100 Index | - 47.3% | Jan. 1973 – March 1975 |
| DAX Index | - 72.2% | Nov. 2000 – March 2003 |
| Gold | - 28.3% | March 2008 – Nov. 2008 |
| Commodities | - 48.2% | June 2008 – Feb. 2009 |
| Bonds | - 5.1% | Sept. 1994 – Jan. 1995 |
Additional Key Metrics for Assessing Portfolio Risk
Maximum drawdown is not the only way to assess portfolio risk; several other metrics are worth knowing. Together, they help you understand a portfolio’s risks and returns. No single metric gives the full picture, so a comprehensive assessment needs a combination of metrics and analytical methods. Here are a few examples:
What is the difference between maximum drawdown and current drawdown?
Maximum drawdown and current drawdown are two terms frequently used in financial analysis to measure portfolio risk. The main difference is that maximum drawdown measures the largest peak-to-trough loss over a specific period, while current drawdown measures how far the portfolio currently stands below its most recent peak.
Maximum drawdown is typically measured over a longer period, such as several years, and shows the largest loss a portfolio has suffered during that time. Current drawdown, by contrast, shows the loss since the portfolio’s most recent high.
If the current drawdown is close to the maximum drawdown, the portfolio is in a deep slump and could suffer further losses. If the current drawdown is much smaller than the maximum drawdown, the portfolio may be on the road to recovery.
How can maximum drawdown be used in practice?
How you interpret maximum drawdown depends on several factors. Here are some ways to approach it:
- Comparison: A high maximum drawdown may indicate that the investment is highly volatile. Compare it with the portfolio’s average volatility to understand its risk profile better.
- Investment horizon: A longer investment horizon can lead to a higher maximum drawdown, as there is more time for market cycles and fluctuations. Take the horizon into account when interpreting the figure.
- Asset classes: Maximum drawdown can vary depending on the asset class. For example, equity investments are generally more volatile than bond investments.
- Risk tolerance: A high maximum drawdown may be unsuitable for a risk-averse investor but acceptable for someone comfortable with risk. It should align with your risk tolerance and investment objectives.
- Portfolio comparison: Compare a portfolio’s maximum drawdown with other investments in the same asset class, or with similar strategies, to understand its risk profile better.
Maximum drawdown can also serve as an entry indicator to help identify favourable entry points in the market. If an ETF or share has just hit its maximum drawdown, it may be oversold and a recovery may follow. However, you should also consider other factors, such as fundamental data, market sentiment and wider economic trends.
Conclusion: Maximum Drawdown: An Important Risk Metric
In summary, maximum drawdown is an important metric for assessing portfolio risk. It shows the largest loss an investor would have suffered over a given period, and so indicates a portfolio’s potential for loss.
A higher maximum drawdown generally signals higher risk and greater volatility. When choosing an investment, make sure its maximum drawdown fits your risk tolerance.
Maximum drawdown can also be used as an entry indicator. Because a deep drawdown often coincides with lower prices, it can signal a potential buying opportunity, though it should not be relied on alone.
You can find current maximum drawdown figures for ETFs and shares on the extraETF profile pages. With a portfolio tracking tool, you can also calculate the maximum drawdown for your own portfolio.
Important Questions About Maximum Drawdown
- Everything You Need to Know About Maximum Drawdown
- Definition: What is the maximum drawdown?
- Why is maximum drawdown important for investors?
- Formula: How is the maximum drawdown calculated?
- What is the maximum drawdown of the MSCI World Index?
- Additional Key Metrics for Assessing Portfolio Risk
- What is the difference between maximum drawdown and current drawdown?
- How can maximum drawdown be used in practice?
- Maximum Drawdown: An Important Risk Metric
- Important Questions About Maximum Drawdown
